BP12B – Single node logging & monitoring
To help understand the content of this document, readers should familiarize themselves with the key definitions and actors and the business process introduction containing the diagram legend.
Overview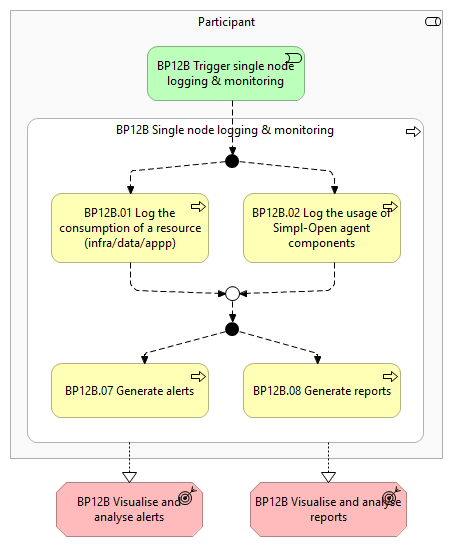
This business process covers the collection, standardisation, and persistence of logs and metrics, the monitoring of the Simpl-Agent, and the visualisation and reporting of data. The logs include gathering metrics like performance data, error logs, and usage statistics. Furthermore, visualisations and reports provide insights into system performance and user activities. This workflow is applicable to all the Participants, namely the Consumers, Providers and the Governance Authority.
It includes the following main steps:
- Log consumption of a resource (infra/data/app): During the consumption of a (infrastructure/data/application) resource, Simpl-Open agent generates technical logs that will be used for various reasons (billing, audit, policy enforcement, regulation compliance, etc.).
- Log usage of Simpl-Open agent components: While they are running, the components of Simpl-Open agent generate both technical logs and business logs that will be used for the purposes of audit and troubleshooting.
- Generate alerts: Alerts get generated when health checks fail or predefined thresholds are exceeded.
- Generate reports: Compile the logged data into reports to provide insights (e.g., system performance, user activities, and issues encountered).
Actors
The following actors are involved:
- Governance Authority
- Provider
- Consumer
In the diagrams, they will be described as Participant.
Assumptions
The following assumptions are made:
- The Simpl-Open agent is configured to capture technical logs that allow to follow the consumption of (infrastructure/data/application) resources.
- The Simpl-Open agent is configured to capture technical logs that allow to follow the usage of the agent components.
- The Simpl-Open agent is configured to capture technical logs that allow to follow the infrastructure and service health.
- The Simpl-Open agent is configured to capture business logs for significant events or actions (related to steps within a business process or other functional use cases).
- A solution is in place to persist the technical and business logs.
- A solution is in place for monitoring, alerting and visualising of the technical and business logs.
Prerequisites
The prerequisites for this workflow are outlined below. These prerequisites must be met to enable the process to occur:
- Data space is configured: The Governance Authority has configured the data space catalogue with the corresponding vocabulary and schemas to have the general structure of a resource description, contract clauses, and other vital components (Business Process 2).
- Participant onboarded: Before the Participant can log & monitor its Simpl-Agent, they should have successfully completed the onboarding business process (Business Process 3A).
Details
The following shows the detailed business process diagram and gives the step descriptions.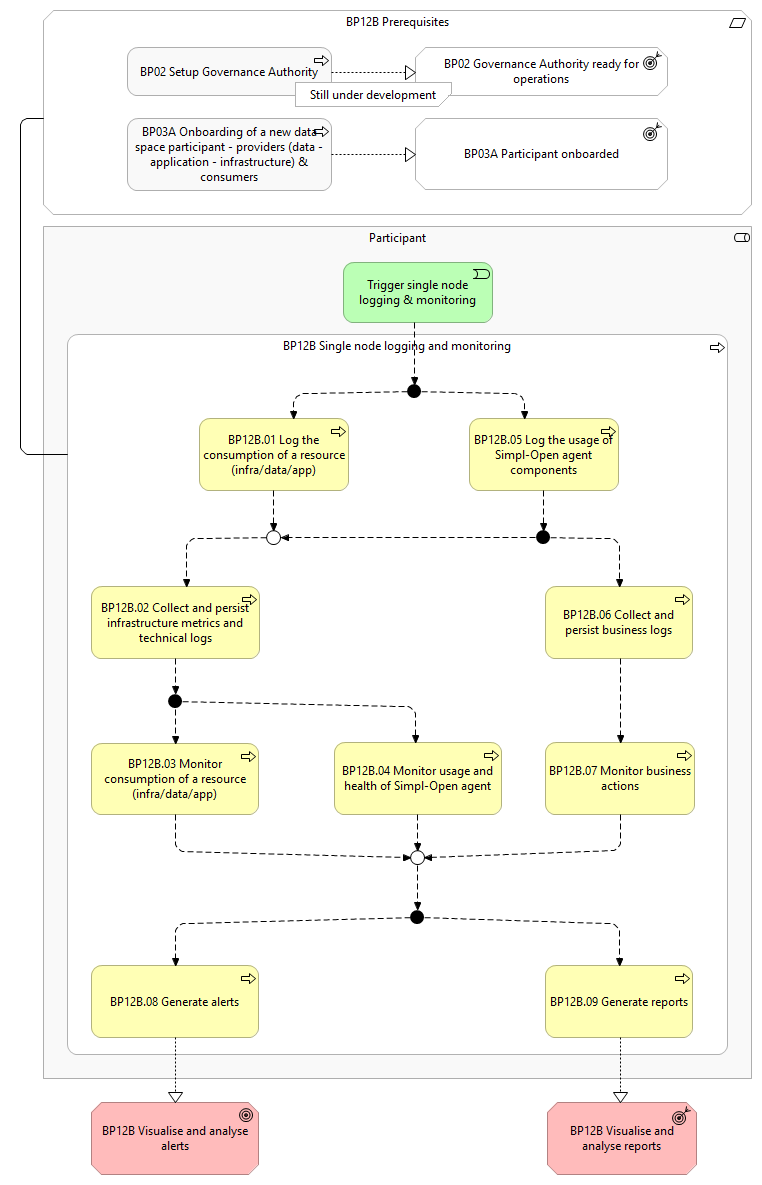
Trigger single node logging & monitoring
While using Simpl-Open, the agent of the Participant initiates the single node logging & monitoring.
BP12B.01 Log the consumption of a resource (infra/data/app)
During the consumption of a (infrastructure/data/application) resource, Simpl-Open agent of the Participant generates technical logs that will be used for various reasons (billing, audit, policy enforcement, regulation compliance, infrastructure metrics, service health, etc.).
This is generally done with a push-based mechanism, but can also be done with a pull-based mechanism for the purpose of monitoring infrastructure metrics and service health.
BP12B.02 Collect and persist infrastructure metrics and technical logs
The Simpl-Open agent of the Participant converts the collected technical logs and infrastructure metrics into a consistent format to facilitate analysis and integration with other monitoring tools.
The collected and standardised technical logs and metrics are persisted in a durable, accessible location for future analysis and access.
BP12B.03 Monitor consumption of a resource (infra/data/app)
The Participant monitors the consumption of resources through a dashboard to enforce policies and regulations compliance.
BP12B.04 Monitor usage and health of Simpl-Open agent
The Participant monitors the Simpl-Open agent usage and health through a dashboard to ensure it is functioning correctly, tracking the usage, its performance, and any errors or warnings.
BP12B.05 Log the usage of Simpl-Open agent components
While they are running, the components of Simpl-Open agent of the Participant generate both technical logs and business logs that will be used for the purposes of audit and troubleshooting.
The business logs are generated for pre-defined significant events or actions (related to steps within a business process or other functional use cases).
BP12B.06 Collect and persist business logs
The Simpl-Open agent of the Participant converts the collected business logs into a consistent format to facilitate analysis and integration with other monitoring tools.
The collected and standardised business logs are persisted in a durable, accessible location for future analysis and access.
BP12B.07 Monitor business actions
The Participant monitors the business actions through a dashboard.
BP12B.08 Generate alerts
The Participant defines alerts and assigns target users to receive the alerts when they occur.
The Simpl-Open agent of the Participant generates alerts when health checks fail or predefined thresholds are exceeded, and shared with the assigned target users.
BP12B.09 Generate reports
The Participant defines and schedules reports based on the logged data to support monitoring and follow up. The Simpl-Open agent of the Participant generates the pre-defined reports according to the schedule.
The Participant defines and generates custom ad-hoc reports based the logged data to support the analysis and follow up of specific issues or analysis.
Outcomes
- Visualise and analyse alerts: Alerts are shared with the assigned target users as they occur. Logs are stored in a consistent and accessible format, making them available for further investigation of the raised alerts.
- Visualise and analyse reports: Logs are stored in a consistent and accessible format for performing ad-hoc analysis supported by queries and aggregated views (e.g., table, diagrams, etc.) of the collected logs to identify patterns, trends, and anomalies (example of who is doing this: IT admin of the Simpl-Open agent).
Use cases and types of logs are described in details in the Logging, Monitoring & Reporting section of the Architecture Document:
Types of logs - Reference model
The following table identifies the different types of logs that can be generated by an IT system together with their definition/description:
| Grouping | Type of logs | Description |
|---|---|---|
| Business logs | Business logs | Record significant events or actions (related to steps within a business process or other functional use cases) that occur within a system, typically used for security, audit, and troubleshooting purposes. |
| Technical logs | Application logs | Record events and activities generated by an application during its runtime, typically used for troubleshooting, monitoring performance, and auditing activities within the application. |
| Database logs | Record events and activities generated by a database (queries, transactions, schema changes), typically used for troubleshooting, ensuring data integrity and auditing access. | |
| System logs | Record events and activities generated by the operating system (OS) and system-level processes. These logs provide valuable information for monitoring system health, diagnosing issues, and ensuring security. System logs can include: low-level system events (kernel event, hardware error), system-level events (service startups/shutdowns/failure), authentication and authorisation events (login attempts, privilege escalation). | |
| Network logs | Record events and activities related to network traffic, devices, and communications within a network. These logs are essential for monitoring network health, diagnosing issues, and ensuring security. Network logs can include: firewall logs (allowed/denied connections, intrusion detection alerts, security policy violations), router and switch logs (device startups, interface status changes, routing protocol updates), DNS logs (queries/responses, cache activity, DNS server configuration changes and errors), proxy logs (user access, URL requests, content filtering, bandwidth usage) and network traffic logs (packet-level data, including source and destination IP addresses, port numbers, protocols, packet payloads). | |
| Security logs | Security logs are not a distinct type of log, they are a subset of all the other logs listed above, which allow to detect and respond to security incidents effectively. Ex: Intrusion detection alerts, security policy violations, anti-virus scans. | |
| Infrastructure metrics | Infrastructure metrics | A metric is a piece of data that has a name, optional labels, and a value. It is not a log per-se, as they need to be retrieved by periodically scrapping an endpoint of the host system (pull instead of push paradigm). Once retrieved, the information is then persisted as a log. |
| Health check | Health check | A health check is a procedure that helps to determine if a component is functioning correctly or not. Just like infrastructure metrics, health checks are not logs per-se, it is an API exposed by each component to return a simple status on the health of the component, which is queried periodically. |
Submission of a contract offer by a Provider to a Consumer
For the sake of simplicity, application, database, system, network and security logs are grouped under the more generic term of Technical Logs.
Use Cases and Types of Logs
| Use case | Type of logs required | Type of metrics required | Description |
|---|---|---|---|
| Log and monitor business actions, mostly for audit purposes. | Business logs | A business log in this case represents a specific step in a business process that is relevant/meaningful to be tracked. E.g. Submission of an onboarding request. | |
| Log and monitor consumption of a resource (infra/data/app) for various reasons (billing, audit, policy enforcement, regulations compliance ...). | Infrastructure metrics | Depending on the type of data or infrastructure resource that is being consumed, different metrics can be relevant: CPU, RAM, I/O, transfer speed, ... | |
| Technical logs | For application usage and for some data usage cases, application and database logs will give information on what is being done with the data/application. | ||
| Log and monitor the usage of a Simpl-Open agent (of its components) for the purposes of audit and troubleshooting. | Technical logs | All types of technical logs are relevant for troubleshooting purposes and some may also be relevant for audit. | |
| Business logs | A business log is generated for each incoming and outgoing operation at the boundaries of the agent (communication towards Tier 1 or Tier 2 users). | ||
| Infrastructure metrics | Infrastructure metrics generated by the deployed components of the agent (CPU, RAM, Disk, ...). | ||
| Monitor the health of the Simpl-Open agent. | Health check | Health is not logged but only monitored (the monitoring queries each technical component in real time to get its health status). |
| L0 - Business Process | Status: Proposed |
Associated L1s - High Level Requirements
To be determined
Please log in or sign up to comment.